

| HOME |
|
MONITORING |
Long-term
|
| ARTICLE |
| LINKS |
| CONTACT |
|
RUS ENG |
Long-term cosmic ray monitoring
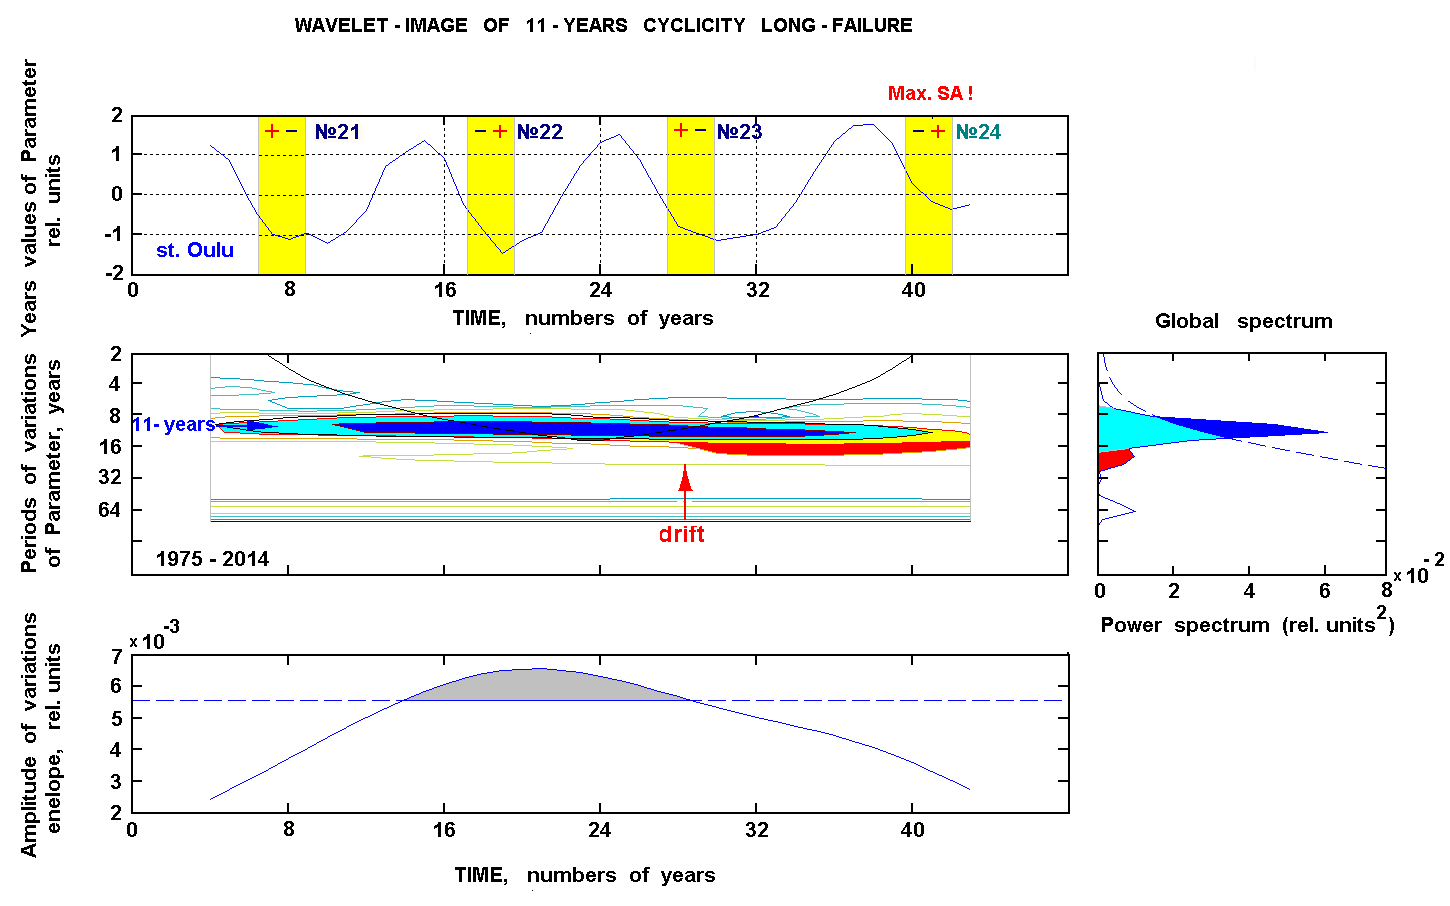
Fig. 1. Above: temporal course of fluctuations parameter for 43 years, about 1972-2014. Below: the amplitude-time-frequency diagram of 11-years variation evolution for the investigated period. On the right: global spectrum, as a whole. Below - bending around amplitudes of variations. The locality of 11-years variation on the diagram is shown by a horizontal arrow at the left. The vertical arrow is indicated of the beginning of low-frequency drift of 23 cycle period. Conditionally, are shown the periods change sign of general magnetic field Sun and, accordingly, numbers cycles. annual values of cosmic ray fluctuations parameter in relative units. The periods of change of a sign on a field are conditionally shown. In an average part of figure, on the diagram - evolution of the period 11-years cycles in time. The location of 11-years variation is noted by a horizontal arrow at the left. The beginning low-frequency DRIFT of the 23 cycle period is indicated by